Projects
Digital Twin for Microgrids and Distribution Networks
PI: Steven Low (Division of Engineering & Applied Science)
SASE: Thuy-Linh Le, Scholar
As more government bodies make commitments towards renewable energy, such as California’s Senate Bill 100 to achieve 100% clean electricity by 2045, distribution grids will need to undergo rapid transformations and build small, ubiquitous distributed energy resources (DERs) that are capable of real‐time measurement, computation, communication, and actuation. With the increase in nodes in the system, grid managers will require a comprehensive monitoring system.
Current distribution grid data is not widely available to the distribution system research community. Moreover, the data collected by current infrastructure control systems lacks the precision and detail necessary for more sophisticated power systems analysis. Thus, most distribution system research must use simulated data.
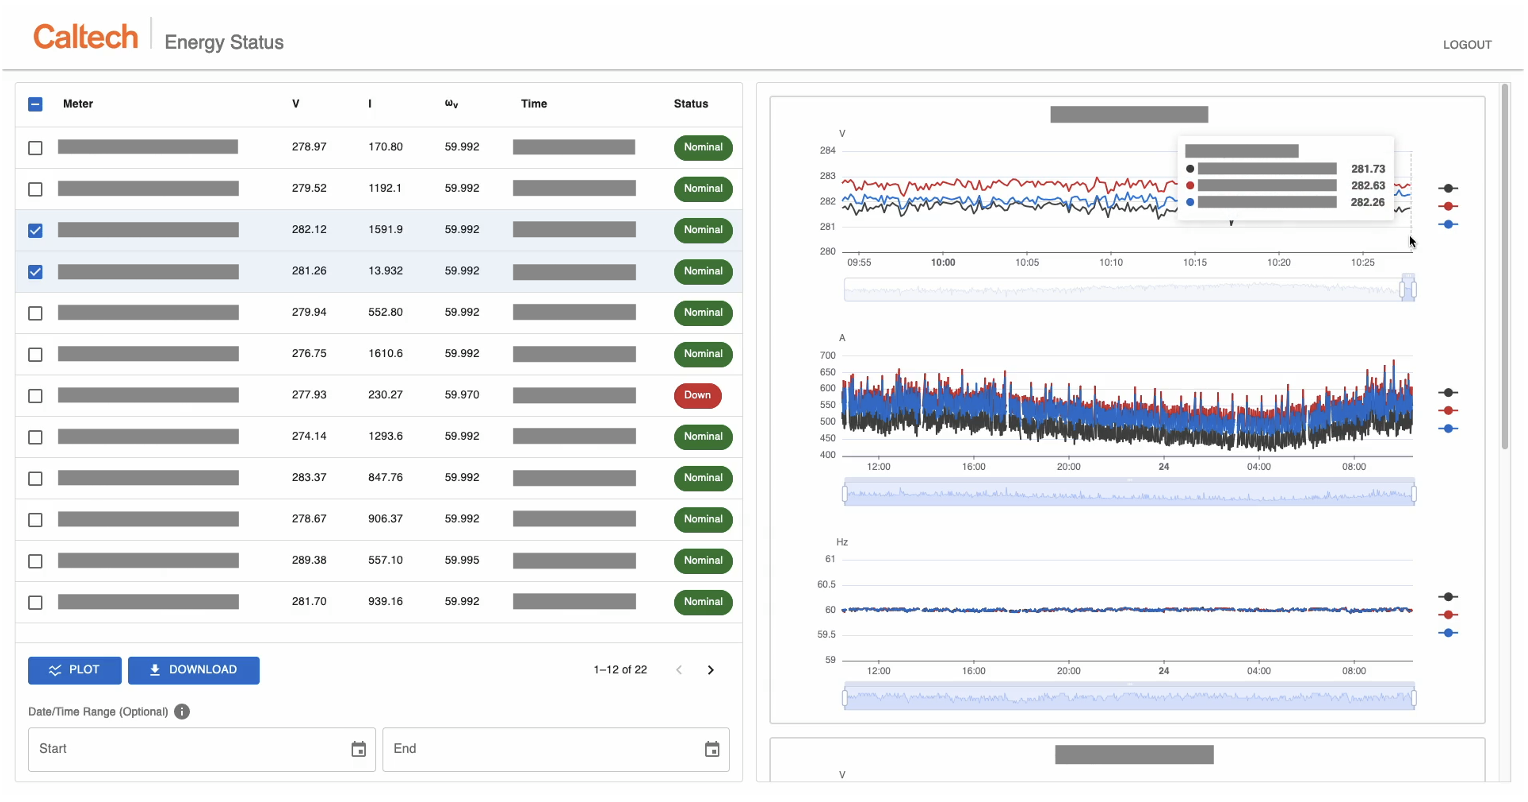
To generate a real-world dataset, Steven Low’s lab has, with guidance from Caltech Facilities, installed a set of smart meters on a subsection of Caltech’s campus. The Schmidt Academy collaborated with the lab to develop a data ingestion pipeline from lab-installed smart meters across Caltech’s campus to a secure online dashboard created by the Scholar. The dashboard contains different pages that provide system-level insight into electrical data in near real-time; make real-time and historical time series data convenient to obtain, visualize, and analyze; and integrate time series data with the power network model.
The Energy Status page allows the user to view real-time and historical data for user-friendly data collection and monitoring for potential outages. It has been used by Caltech Facilities to successfully troubleshoot outages and collect data and plots for reports.
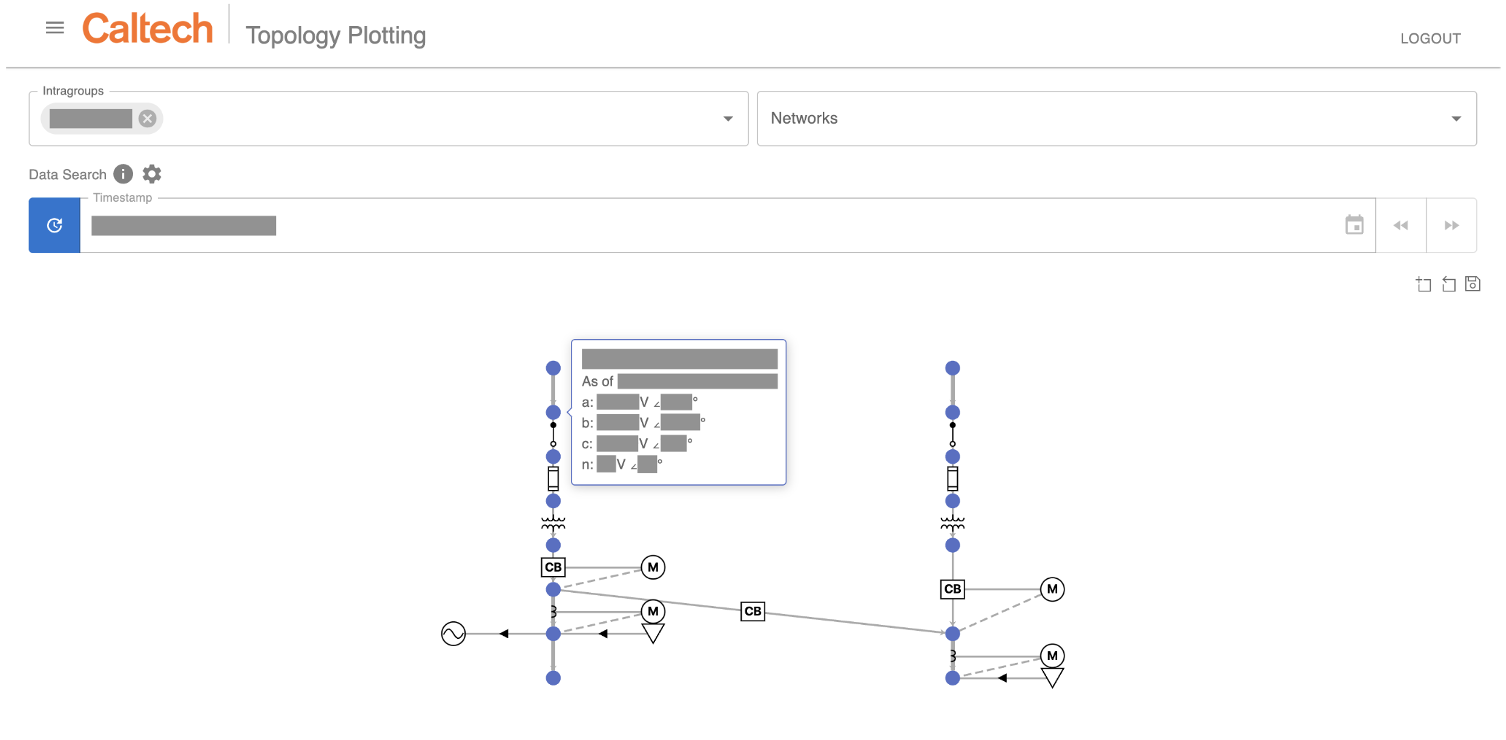
Another obstacle to power system analysis is that some research directions require a comprehensive record of the network model. Traditionally, in campus settings, this information is stored as PDFs and various heterogeneous spreadsheets, which are slow to get updated and not compatible with software development. As a solution, the Scholar proposed using JSON to represent the network in a more code-friendly format that can then be validated via a schema and scripts. With the guarantee of a valid network, the lab can automate analysis and calculation algorithms such as state estimation. The dashboard’s Topology Plotting page couples this data with graphical representations of the network for easy visual analysis and monitoring.
In regard to the future, there are plans to release an anonymized and time-delayed version of the real-world dataset (for security reasons) to the distribution grid research community. The dashboard is easily extensible and can be applied to other real-world power networks. For example, the lab has plans to deploy a dashboard in partnership with Moreno Valley Electric Utility.